

During the preheating period, identifying traffic drops should focus on two sets of metrics: interaction depth and conversion paths. At the same time, it's crucial to recognize that third-party social media operations analytics tools are limited to capturing surface-level public metrics due to permission boundaries. Many teams, when facing a decline in conversions, instinctively rush to purchase more expensive tools to monitor view curves, neglecting that the real breakpoints often hide in data blind spots inaccessible to third-party interfaces.
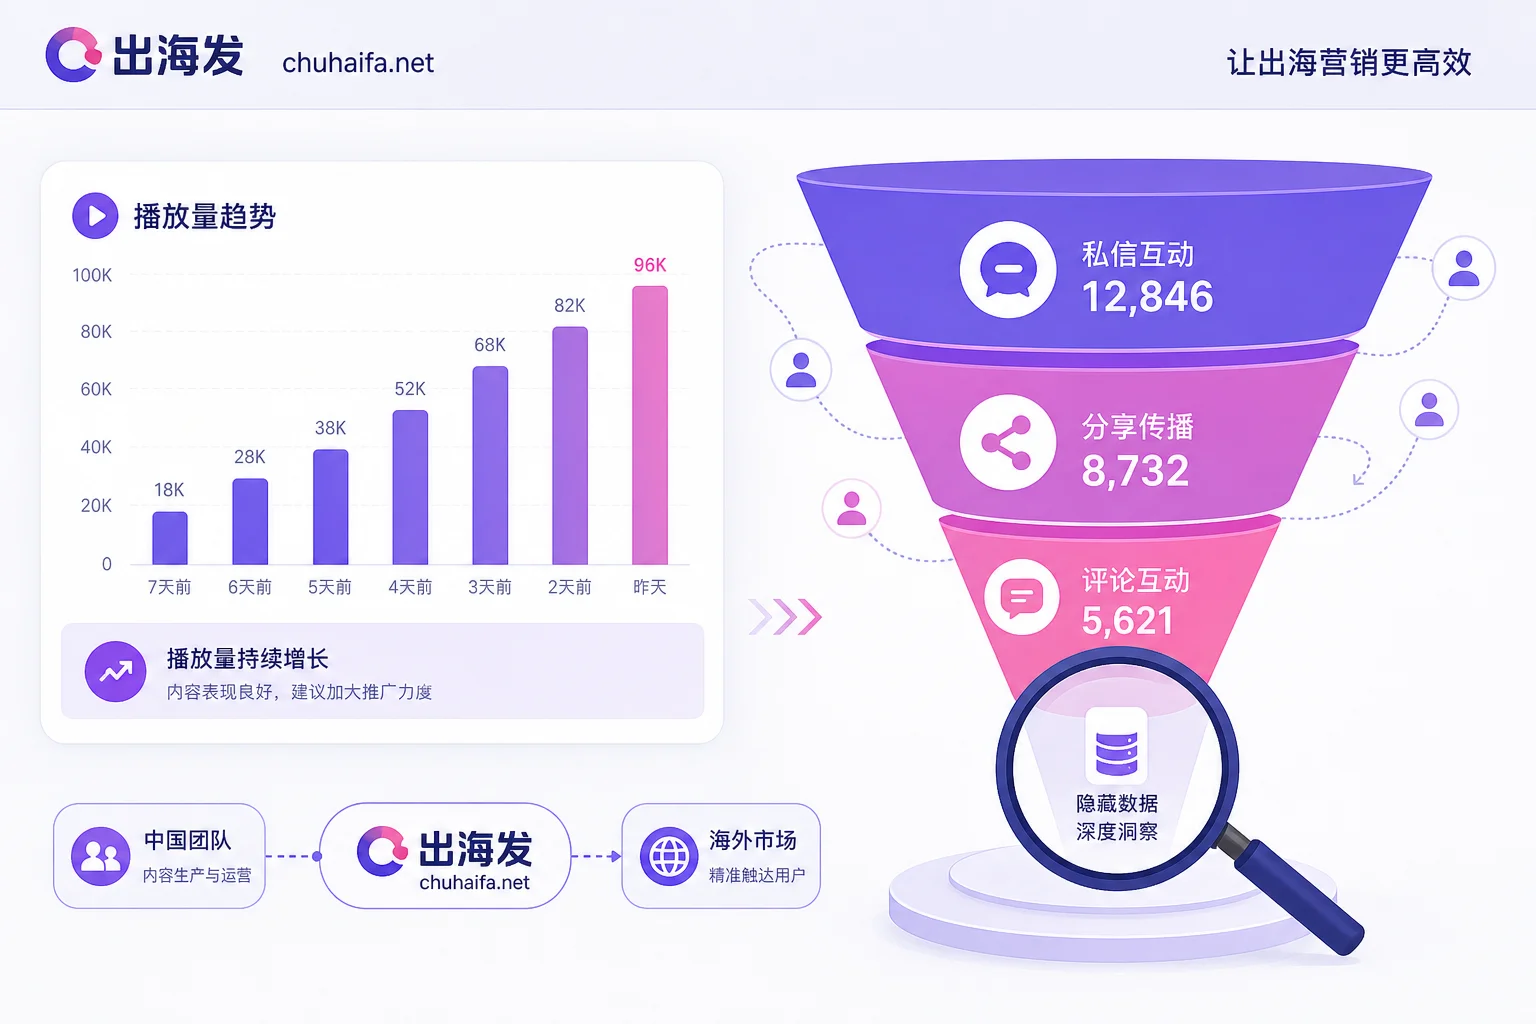
Traffic Drops Often Occur in Columns the Tool Can't See
When views and likes decline, this is usually the result, not the cause. In cross-border short video operations, fluctuations in surface-level metrics often lag behind fractures in the user decision chain. Relying solely on data scraped from public interfaces can easily miss the key variables that drive conversions. For instance, users might engage via private messages to inquire about product details after watching a video, or privately share the video with friends for further discussion. These behaviors directly indicate purchase intent but are nearly invisible in conventional reports.
Therefore, operators should shift their focus from mere exposure metrics to interaction depth and conversion paths. Only by identifying which data cannot be automatically captured by tools can a reasonable manual supplementation mechanism be configured, avoiding misled scheduling decisions based on superficial fluctuations.
Preheating Shift and Comment Upgrades Change Metric Calibration
In early September 2026, TikTok Shop UK launched the September Campaign (For You Days). The official recommendation was for sellers to publish shoppable short videos ahead of the event for content preheating. This strategy shifts traffic acquisition from a single-point burst on the event day to a combination of "advance seeding + content preheating + conversion during the big sale." Concurrently, on September 3, 2026, TikTok announced upgrades to the comment section, introducing voice comments up to 60 seconds, creator comment polls with up to five options, and carousel comments supporting up to nine images per comment.
With these two changes, dwell time and interaction patterns in the comment section have become highly complex. Traditional statistics that only count the number of comments fail to reflect the true quality of interactions. The immersion brought by voice comments and the engagement triggered by poll options mean new interaction dimensions must be included in monitoring; otherwise, dashboard data will be disconnected from actual user behavior.
Data Discontinuity Between Third-Party Tools and Native Backend
Regarding whether social media analytics tools can view private message share data, the answer is no. Third-party tools primarily obtain surface-level metrics like impressions, views, likes, public comments, and public shares through public APIs. However, deeper data involving user privacy, such as private message inquiries, in-app private sharing records, and non-text rich media interactions like voice and polls, are restricted by platform privacy permissions and cannot be scraped by third parties.
Claims from some tools that they can pull full competitor private messages are inconsistent with mainstream platform interface limitations. For this data, teams can only rely on official native backends or manual tagging to fill gaps. Understanding this layered logic helps avoid chasing unrealistic features during product selection, instead focusing on how to effectively combine public data with internal manual records.
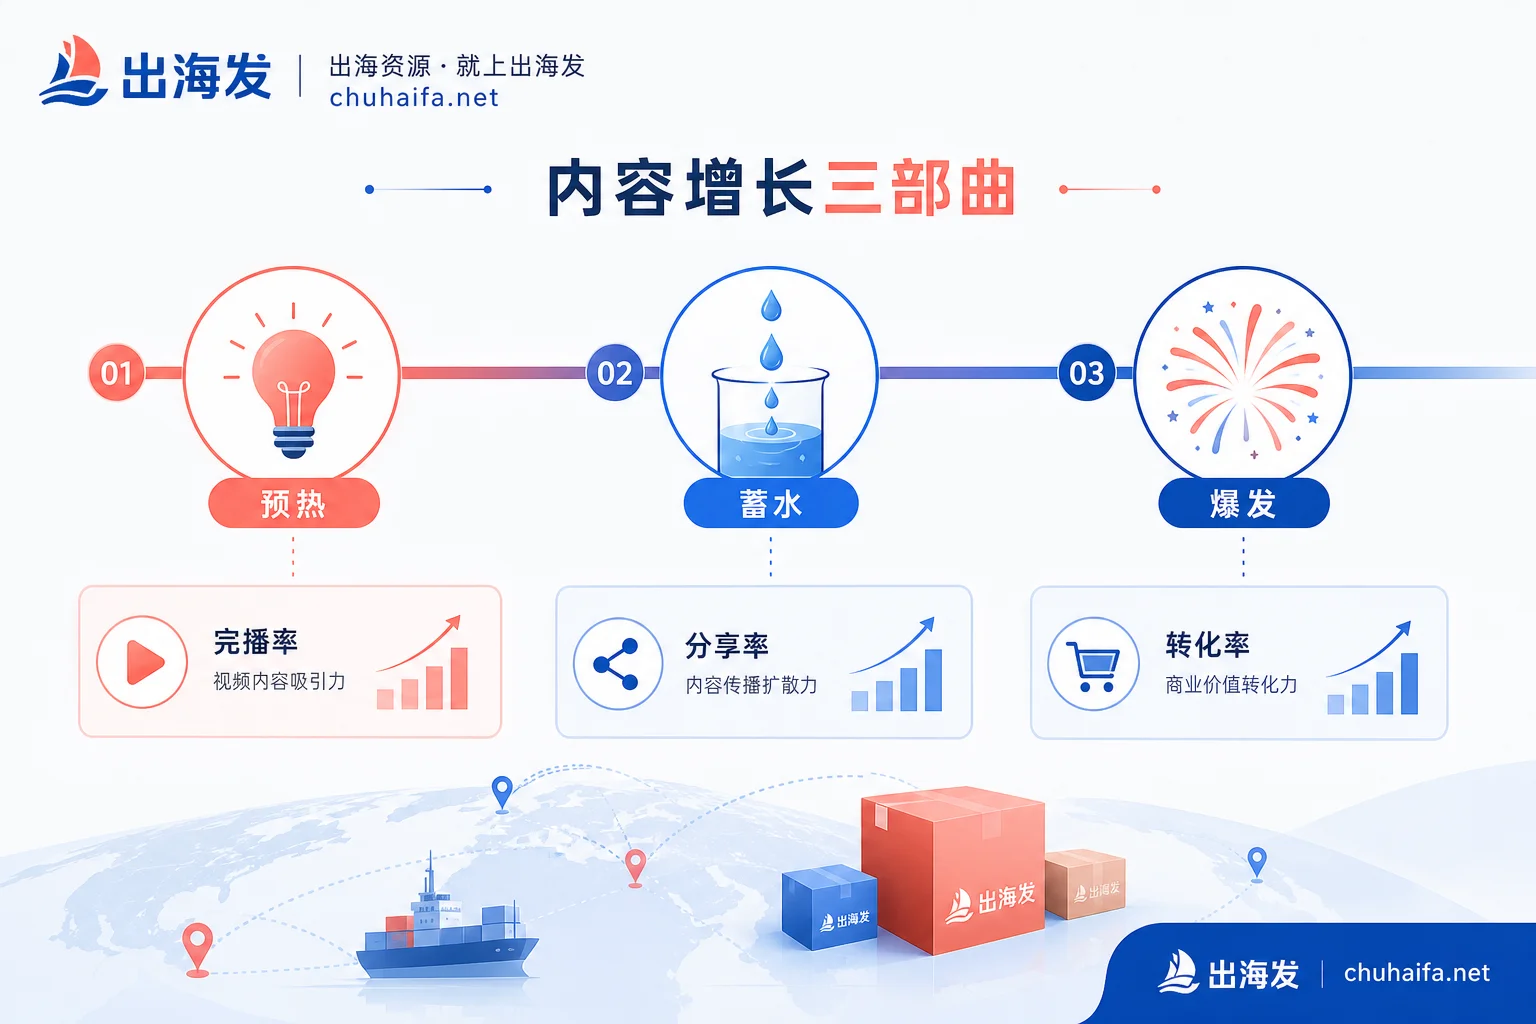
Phased Monitoring: Different Data Focus for Warm-Up, Preheating, and Launch
Regarding the question of how long before a big sale to start publishing seeding videos, industry media commonly suggests a reference window of 7 to 14 days before the official event launch, with specific lead time adjusted according to product category preparation and content production capacity. Different stages require attention to different data columns:
| Stage | Core Observation Metrics | Purpose | Actionable Criteria |
|---|---|---|---|
| Warm-Up | First 3-second drop-off rate, completion distribution | Verify whether the content hook is effective | At least 5 video samples; compare with historical averages for the same category; source from native backend |
| Preheating | Comment depth, collection trends, share rate | Assess content's organic spread potential | At least 10 video samples; cross-compare with warm-up stage; third-party tools as auxiliary |
| Launch | Product page click-through rate, order conversion rate | Confirm traffic materializes into sales | At least 20 video samples; compare with preheating stage funnel; must be sourced from native backend |
At each stage, accumulate a sufficient number of sample videos before drawing conclusions, avoiding the pitfall of using incidental fluctuations from a single video as a basis for adjusting overall strategy. This phased perspective helps teams more accurately identify which link is the bottleneck.
Anomaly Troubleshooting: Order of Content, Distribution, and Conversion
When product videos have no views and you're wondering where to start, if views are stagnating, it's recommended to backtrack in the following order: first, check the content side, comparing completion distribution of concurrent materials to confirm if the opening lacks appeal; second, examine the distribution side, reviewing the number of product videos allowed per day on TikTok Shop and timing choices; if you suspect how to recover from TikTok video restrictions, avoid blindly deleting and reposting to restore traffic without verifying official mechanisms, as this may trigger risk-control rules against duplicate low-quality content; finally, investigate the conversion side, checking product page loading speed and private message response timeliness.
After each adjustment, observe the performance of the next few new videos, focusing on feedback from completion rate and interaction rate. Which should you focus on more: completion rate or interaction rate? During the preheating period, usually fix completion first, ensuring users watch to the end, then talk about interaction, as high completion is a prerequisite for deep interactions.
Team Size Determines Different Tool Configurations
Teams of varying scales have significant differences in data capability building. In the single-account trial phase, the native backend combined with manual records is usually sufficient, with emphasis on manually archiving comment section interactions and private message leads. Once in the stable sales generation phase, cross-cycle backtracking and material-level attribution analysis are needed. When selecting social media analytics tools at this point, check data source coverage, data granularity, historical backtracking period, and multi-account consolidation capability. Chuhai Fa categorizes social media and content creation tools by data source and application scenario, making it convenient for operators to compare dimension by dimension and find suitable resource entrances.
In the multi-account matrix phase, the challenge lies in unifying public metric criteria across different accounts, avoiding misjudgment caused by inconsistent denominators due to differences in historical posting volume, follower count, content category, and statistical time windows. As for whether free social media analytics tools are sufficient, it depends on the team's need for historical data backtracking frequency. If only recent public metrics need monitoring, the free version may suffice; but for long-term trend analysis or refined attribution, the backtracking limitations of free versions become a bottleneck.
FAQ
Can third-party analytics tools count private messages and private shares?
No. Due to platform privacy restrictions, third-party tools can only obtain surface data like impressions, views, likes, and public comments through public interfaces. Deep interaction details such as private message inquiries, private friend shares, and voice/poll interactions must be viewed in the official native backend or manually recorded by the team. Any claims that such data can be directly scraped do not comply with interface standards.
Where to view data for new interaction formats like voice comments?
Currently, it mainly relies on TikTok's official native backend. Since voice comments and comment polls are relatively new rich media interaction forms, most third-party social media analytics tools have not fully adapted their fine-grained statistics. It is recommended that operators export relevant logs from the native backend and combine with manual sampling analysis to evaluate the actual contribution of these new formats to interaction depth.
When views don't pick up, should we first adjust content or scheduling?
Prioritize content. During the preheating period, a high first 3-second drop-off rate usually indicates an ineffective content hook, and adjusting publishing time at this point yields little. First, optimize the visual impact or copy suspense at the beginning of the video to improve the completion rate foundation; once content quality stabilizes, fine-tune the scheduling strategy to match the target audience's peak active hours.
When does the free version of tools become insufficient?
The judgment standard lies in team needs: whether long-period backtracking beyond free quotas is required, whether material-level attribution is needed, or cross-account consolidation. If so, the free version typically falls short on historical backtracking and multi-account aggregation features. Specific quotas vary by tool and need to be checked individually. Once entering the stable order generation stage, the long-term data retention and multi-dimensional label analysis provided by paid versions become necessary support.
What criteria errors are common when merging and comparing data across multiple accounts?
A common mistake is directly comparing absolute values across accounts while ignoring differences in follower base, historical posting volume, and statistical time windows that lead to inconsistent denominators. The correct approach is to convert absolute values into ratio metrics (such as interaction rate, conversion rate) and ensure all data is from the same time window, excluding interference from exceptional viral hits, to establish a fair comparison benchmark based on relative performance.
It is recommended that readers first label the missing columns in their existing dashboards according to the phased criteria in this article, then compare candidate tools based on data source, granularity, and backtracking period; when needing to browse social media and content creation tools by category, you can refer to the resource classification on Chuhai Fa.