

Here's the short answer: to view your own account's engagement data, on mobile go to "Profile → ☰ Menu → TikTok Studio → Analytics"; to see likes, comments, shares, and saves for a specific video, tap "More data" directly on that video's playback page; on desktop, log in to tiktok.com and access TikTok Studio web version to view charts and export tables; for promoted ad videos, check the TikTok Ads Manager.
These entry points show different levels of data. Below, we break it down by what you want to check.
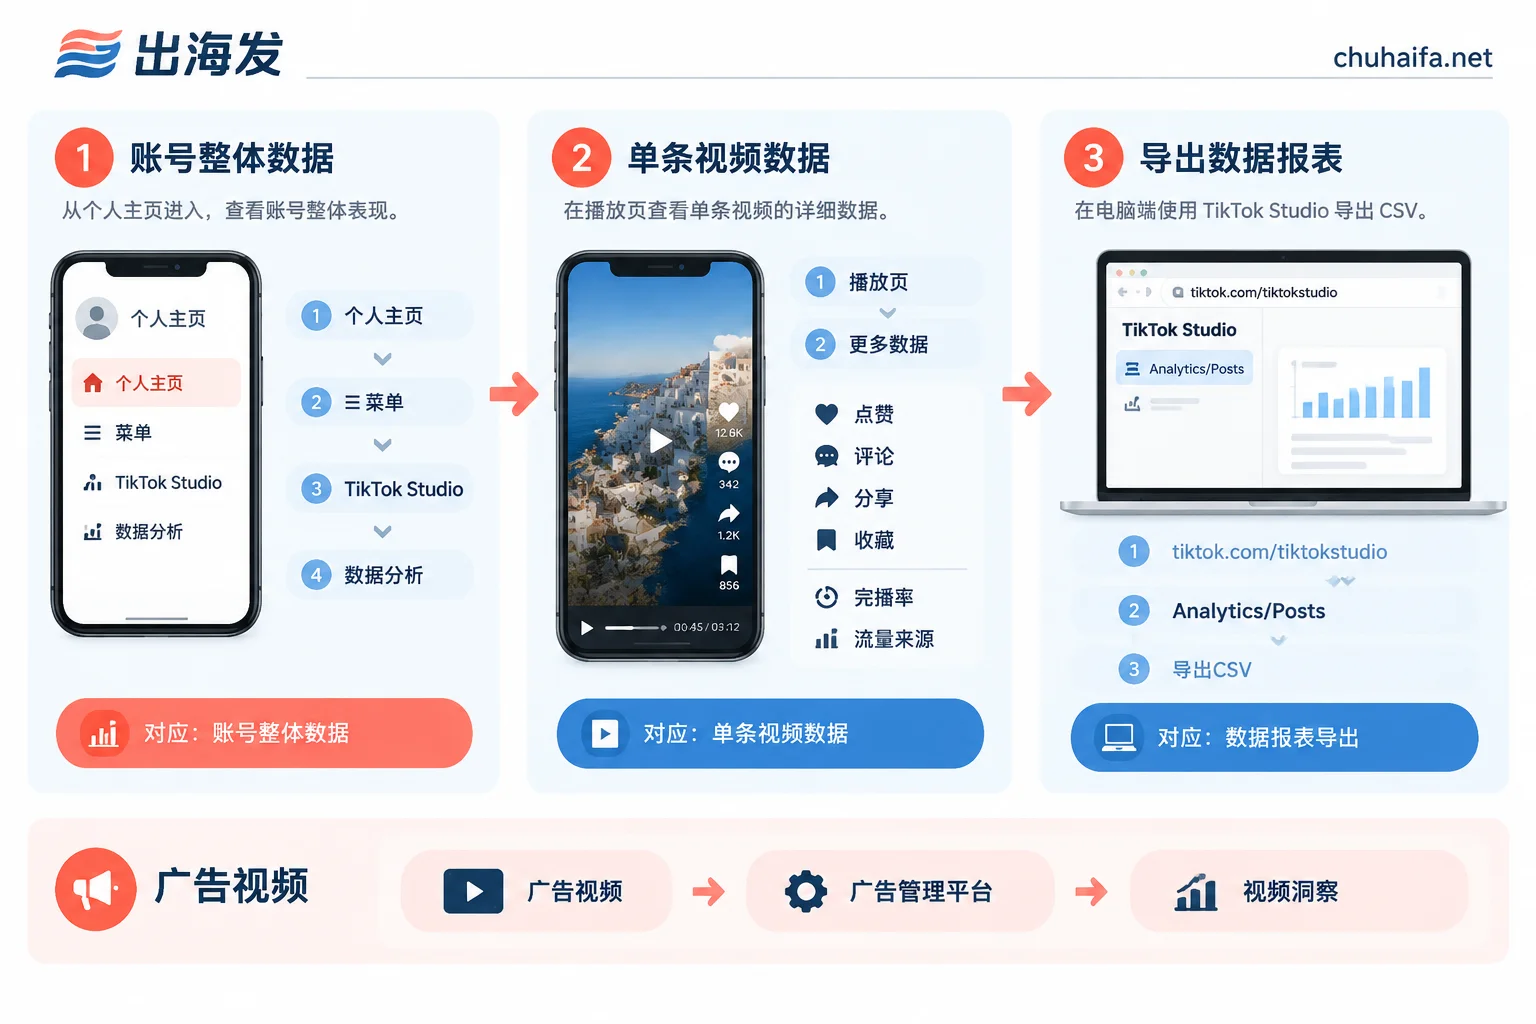
First, determine which level you need
- Account overall: Total plays, likes, comments, shares, and profile visits across all videos over a period, used to gauge overall account trends.
- Single video: Likes, comments, shares, saves for one video, plus average watch time, completion rate, and traffic sources, used to assess what works and what doesn't in that content.
- Ad video: Content promoted through Ads Manager; data is in the ads dashboard, not in the app's creator analytics.
Also, backend data is only available to the account owner. For others' videos, you can only see publicly displayed counts on the playback page—no completion rate or traffic sources.
Mobile: View overall account engagement data
- Open the TikTok app and tap "Profile" in the bottom right.
- Tap the "☰" menu in the top right.
- Select "TikTok Studio". In some versions or regions, this may appear as "Creator Tools"—it's the same entry point.
- Tap "Analytics".
- In the "Overview" or "Engagement" tab, switch the time period to see total plays, likes, comments, shares, and profile visits for that period.
This is ideal for weekly or monthly reviews to spot overall trends, such as whether engagement rises and falls with posting frequency or is driven by a few viral hits.
Mobile: View likes, comments, shares, and saves for a single video
- Go to your profile and tap the video you want to check.
- At the bottom or bottom-right of the video, find and tap "More insights" (or "More data").
In the single video data panel, you'll see:
- Likes, comments, shares, saves (Saves/Favorites);
- Average watch time and completion rate;
- Traffic source breakdown, e.g., from For You or profile.
If your account has Comment insights, it's also under the "Engagement" tab in this panel, summarizing comment content. This is an AI feature and may not be available to all accounts.
Single video data is best for comparing similar content: when engagement is low, first check average watch time and completion rate to determine if the opening failed to retain viewers or if they watched but weren't motivated to like or save.
Desktop: View charts and export tables
For weekly reports or putting data into spreadsheets for comparison, desktop is more convenient:
- Open tiktok.com in a browser and log in.
- Hover over your profile picture in the top right and click "View Analytics"; or go directly to tiktok.com/tiktokstudio for TikTok Studio web.
- In the left menu, select "Analytics" for overall account charts, or "Posts" to view video data individually.
- To save or analyze further, use the download/export feature to save data as Excel or CSV.
Exported tables can be archived weekly, making it much easier to compare performance across stages and topics later.
Can't find the analytics entry? Check these first
- No public videos yet: The analytics panel usually requires at least one public video. Accounts that only watch videos without posting can't generate comprehensive analytics.
- Analytics not enabled: Some accounts need to manually tap "Turn on analytics" the first time. Data starts showing after activation.
- Different menu names: Interface names may vary by region and version due to gradual rollouts. The entry might be called "TikTok Studio" or "Creator Tools"—check both if you can't find it, and update the app to the latest version.
- Account type: Both personal and business accounts can use TikTok Studio's analytics tools; no need to switch account type just to view data.
Promoted ad videos: Check Ads Manager
If a video is commercial content promoted via TikTok Ads Manager, go to the Ads Manager and select from the "Analytics" dropdown:
- Video Insights: See second-by-second clicks, plays, comments, etc., and compare with industry benchmarks—great for pinpointing when viewers drop off.
- Audience Insights: See which demographics are engaging with the ad.
Keep organic and ad video data separate; don't mix them when reviewing.
Managing data as your accounts grow
With one or two accounts, the official backend plus periodic table exports is enough. As accounts multiply, or if you're on TikTok, YouTube Shorts, and Instagram Reels simultaneously, a common approach is:
- Export CSV from TikTok Studio web for each account on a regular schedule;
- Standardize field names and definitions for plays, likes, comments, shares, and saves, then consolidate into one table;
- For large volumes and frequent updates, consider third-party social media data tools or automated connectors.
For how to align fields across platforms, see How to consolidate multi-platform social media data into one table; to explore free tools that complement official backends, see What free social media analytics tools are available. If your data shows videos stalling and engagement not rising, check Where to start troubleshooting low views on product videos.
Once you've determined you need additional social media or operations tools, browse the Overseas Promotion category on ChuhaiFa; for ad-focused analytics, compare options in the Ad Tools category. Refer to each tool's official site for features and pricing.