

To do social media data analysis at zero cost, a reliable combination has four parts. Platform official dashboards handle deep data for your own accounts. Tools like Metricool and Buffer put multiple platforms into a single dashboard. Social Blade is used to check public growth of competitors and influencers. If you also need to know how much social media brings in orders for your independent site, add Google Analytics 4 and UTM links.
These types of tools are not substitutes for each other; each answers a different question. Below, in the order of "first lay the foundation, then supplement," we explain what each type can show, where the free version falls short, and when it is worth adding.
Free plan quotas may change. The versions described below are from when the information was compiled; please refer to each vendor's official pricing page before signing up.
First determine which type of data you need
Before choosing tools, match your needs:
- Your own account's audience and engagement: who is watching, which country they come from, which content has high engagement. Only the platform itself has the most complete data for this, so use the official dashboard.
- Comparing multiple platforms side by side: when running Instagram, Facebook, and TikTok simultaneously, you don't want to switch between several dashboards every day. Use a third-party aggregation tool.
- Other accounts' performance: competitors' follower growth pace, whether the data of influencer partners is normal. You don't have the other party's authorization, so you can only use public data tools.
- Sales brought by social media: whether users place orders after clicking through to your independent site. Social media dashboards usually can't see this part; you need website analytics tools with UTM.
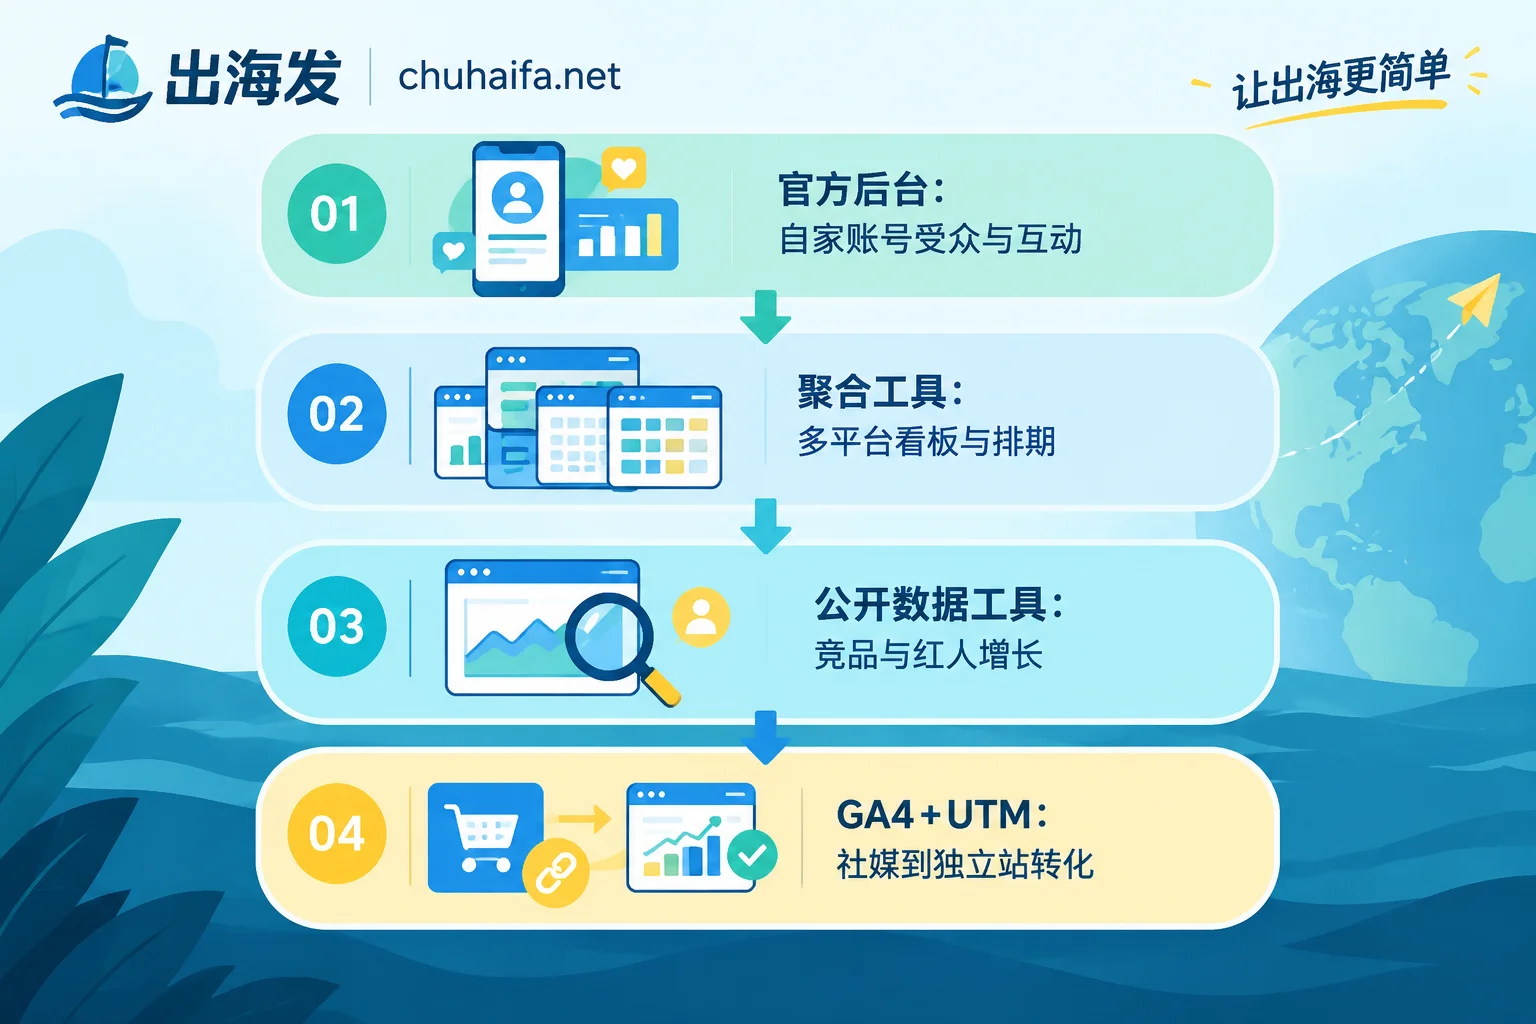
Layer 1: Platform official dashboards, free and most complete for first-party data
All major platforms have built-in analytics dashboards, such as Meta Business Suite, YouTube Studio, TikTok Studio, and LinkedIn page analytics. They are free, data comes directly from the platform, and they are more reliable than third-party tools for audience demographics and engagement depth.
Take Meta Business Suite as an example; it can centrally view data for Facebook Pages and Instagram accounts:
- Reach and engagement for the past 28 days or a custom period
- Followers' age, gender, country and region distribution
- Ad performance
If you mainly work on Facebook and Instagram, this one dashboard can handle most daily analysis. Other platforms' dashboards have their own metrics and definitions; for specifics, refer to each platform's dashboard.
The limitation of official dashboards is that each looks at its own data. Metric definitions across platforms are not completely consistent; for example, "reach" and "views" are counted differently. To compare horizontally, you can only export data yourself and aggregate. For how to unify fields and when manual merging is enough, see How to aggregate multi-platform social media data into one table.
Layer 2: Metricool or Buffer for a basic multi-platform dashboard
If your accounts span more than two or three platforms and you want to view data and schedule posts in one interface, you can add a third-party aggregation tool. These two are often compared in free versions:
| Metricool Free | Buffer Free | |
|---|---|---|
| Management scope | 1 brand, can connect major social media (excluding LinkedIn and X) | Up to 3 social channels |
| Analytics | 30-day historical data dashboard | Basic post performance and engagement data |
| Post scheduling | Up to 20 posts per month | Up to 10 pending posts per channel |
| Competitors | Can track public data of up to 5 competitor accounts | Not mentioned in materials |
| Report export | Does not support PDF/PPT export or custom reports | — |
How to choose:
- If you value data and competitor comparison more, choose Metricool. Its free version includes a 30-day analytics dashboard and competitor tracking, which is relatively rich for a free tier. But if your main platforms are LinkedIn or X, its free version does not cover them.
- If you value unified publishing more and only need basic analytics, choose Buffer. It suits individuals or small teams starting out to manage posting across several channels. Before connecting, confirm that the platforms you use can be connected in the free version.
If using both free versions, you can divide by brand or platform; there's no need to duplicate the same accounts on both.
Layer 3: Social Blade for checking public growth of competitors and influencers
Social Blade free lookup does not require authorization from the other account; just enter the username to view public data for YouTube, TikTok, Instagram, Twitch, etc., including:
- Historical follower trends and daily follower changes
- Estimated earnings range from views
- Account rating
It suits two scenarios. One is doing due diligence before partnering with an influencer: if the follower curve suddenly spikes and then falls, it's worth asking more questions. The other is observing competitors' growth pace: compare their follower peaks with published content to judge which type of content is gaining traction.
Note that earnings are estimated ranges and cannot be taken as the other party's actual income. It can only see public data, not the other party's audience demographics or engagement details.
From social media to sales: use GA4 plus UTM to fill in the last part
Social media dashboards track behavior within the platform. After users click through to your independent site, whether they add to cart or place an order is basically invisible to it, and free third-party tools generally cannot see it either.
To track this part, the usual approach is:
- Add UTM parameters to every link placed on social media, at least specifying
utm_source(e.g., instagram),utm_medium(e.g., social), andutm_campaign(campaign name). - Integrate Google Analytics 4 on your independent site.
- In GA4, view traffic, conversions, and revenue by source and campaign to compare which platform and which campaign actually brought orders.
If you only sell within the platform and don't drive traffic to an independent site, you can skip this step.
Free versions usually have these limitations
- Short historical lookback: Most third-party free tools only retain data for about 30 days. For quarterly comparisons, export regularly each month and keep your own table.
- Incomplete platform coverage: Some tools do not support X or LinkedIn on the free tier, or require payment to unlock. If you mainly work on these two platforms, start with their official dashboards.
- Limited report export: Metricool free version cannot export PDF/PPT reports. If you need to regularly submit reports to your boss or clients, either manually organize screenshots or consider a paid version.
- No account environment handling: These analytics tools only read data; they do not manage login environments. If your team uses multiple accounts and multiple people log into the same set of dashboards, account isolation must be solved with other tools; analytics tools cannot replace this.
Combinations based on team situation
- Individual, mainly one platform: Official dashboard is enough; export data once a month for archiving.
- Small team, operating two or three platforms: Official dashboard plus either Metricool or Buffer; the former leans toward analytics, the latter toward publishing.
- Looking for influencer partnerships or monitoring competitors: Add Social Blade for due diligence and trend watching.
- Has an independent site: Add UTM to all social media links and use GA4 to view conversions.
If data shows some videos have abnormally low views, for troubleshooting order see Where to start checking when a product video has no views.
Once you've determined which types of tools you need, you can browse the Overseas Promotion category to find social media operations and analytics tools. If your team needs multi-account login, then check the Antidetect Browser category for environment isolation solutions.