

Here's the answer up front. For overseas social media weekly reports, I recommend tracking only five groups of metrics:
- Reach and exposure: Reach, Impressions
- Engagement quality: engagement rate, plus shares, saves, and meaningful comments; for short videos, add average watch time and completion rate
- Traffic and conversion: profile link clicks, post link clicks, click-through rate (CTR), website sessions with UTM parameters, and leads, add-to-carts, or orders
- Account health: net follower growth, unfollows; if the team also handles customer service, add DM volume and average response time
- Content review: weekly posting volume and format mix, the top 3 and bottom performers with reasons for each
Every number should be compared to last week (week-over-week, WoW). After each notable rise or fall, write one sentence on "what to do next week." A weekly report that's just a pile of numbers with no next actions is basically unreadable.
First, clarify the division of labor between weekly and monthly reports
Weekly reports are for tactical adjustments: which format, topic, or posting time worked this week, whether to change next week's schedule, and what A/B test results show. Brand equity, long-term growth, and business ROI belong in monthly or quarterly reports—weekly data fluctuates too much to support those conclusions.
So you don't need to cram every backend number into the weekly report. Divide metrics into two categories: KPIs are directly tied to current goals and must be reported weekly; other metrics are only brought up to explain anomalies when they occur. For example, if this quarter's goal is driving traffic to your DTC site, link clicks and UTM sessions are KPIs, while likes are just reference.
The five metric groups in detail
1. Reach and exposure: Is content entering a larger traffic pool?
- Reach: how many unique users saw the content. On algorithm-driven platforms like Instagram and TikTok, week-over-week changes in Reach best reflect whether content is being pushed to more people.
- Impressions: total number of times content was displayed; if the same person sees it twice, that counts as two impressions.
- Impressions ÷ Reach: roughly how many times each person saw it on average. If this ratio rises while Reach doesn't, it usually means content is mostly being shown repeatedly to existing followers and not spreading.
When Reach declines for consecutive weeks, first check your posting itself: has posting volume changed, is creative repetitive, is the account being throttled? For short video accounts, you can refer to the step-by-step troubleshooting method in Where to Start Checking When a Product Video Gets No Views.
2. Engagement quality: Look less at likes, more at shares and saves
Likes are low-cost and have limited reference value. In weekly reports, prioritize tracking these actions:
- Shares: content's ability to spread; users are willing to pass it on.
- Saves: content's usefulness; also reflects purchase or inquiry intent.
- Meaningful comments: real discussion after removing emoji spam and promotional comments.
- Short videos: additionally track average watch time and completion rate. Videos that lose viewers in the first few seconds usually have a hook problem at the start, not a topic problem.
For engagement rate, a common range: 1%–3% is average, above 3% is good. It varies a lot by platform—Instagram and LinkedIn tend to be above average. Also note that some calculate engagement rate based on Reach, others on follower count. Once your team settles on one formula, don't change it, or WoW comparisons become meaningless. For where to find TikTok's engagement data, see Where to Find TikTok Engagement Data.
3. Traffic and conversion: Is social media traffic being captured by the business?
- Profile link clicks and post link clicks, plus corresponding CTR
- UTM sessions: links sent out should carry UTM parameters so your web analytics can show which platform and which post drove the visit. Without UTM, social traffic easily gets lumped into "direct" or a vague "from a platform."
Business results: choose one primary metric based on business type.
- Cross-border e-commerce: add-to-carts, orders
- B2B foreign trade: form leads, inquiries
- SaaS or app: usually registrations, trials, or downloads
If leads come from multiple platforms and private channels at the same time, deduplicate before counting, otherwise social media's contribution will be overcounted. For details, see How to Deduplicate Cross-Border Private Domain Customer Counts.
4. Account health: Look at net follower growth, not total followers
Total followers change very little week to week and aren't meaningful to report. In the weekly report, you should look at:
- Net follower growth = new followers − unfollows
- Unfollows and churn rate: if unfollows suddenly spike in a week, check three directions: did you post a controversial topic or something off-brand that week; did posting frequency suddenly increase; did paid ads bring in a mismatched audience.
If the social account also handles customer service, add three more: inbox DM volume, average response time, resolution rate. When DM volume rises but response slows, flag it in the weekly report—it usually means you need more staff or a shift schedule.
5. Content review: The most actionable part for next week
- Weekly posting volume and format mix: how many short videos (Reels/Shorts), carousels, and static image posts.
- Top 3 best-performing posts and bottom performers: break down the reasons for each from four angles: topic, visual hook, copy CTA, posting time.
Write the results as two lists: "what to keep doing next week" and "what to change next week." Next week's schedule and test plan can come directly from these two lists.
Measurement rules: If your weekly numbers don't match, it's usually these reasons
- Fixed measurement period: choose either calendar week (Monday–Sunday) or rolling 7 days; once chosen, don't switch back and forth.
- Separate new vs. cumulative: don't put "this week's views" and "account total views" in the same column. For week-over-week comparisons, only use single-week new data.
- Data sync delays: when aggregating data through third-party platforms, account for refresh delays. For example, some third-party tools syncing TikTok analytics data typically have a 24–48 hour delay. If you produce last week's report Monday morning, data for Sunday's posts may still be incomplete. You can push the report to Tuesday or note the data cutoff time in the report.
How to lay out a one-page weekly report
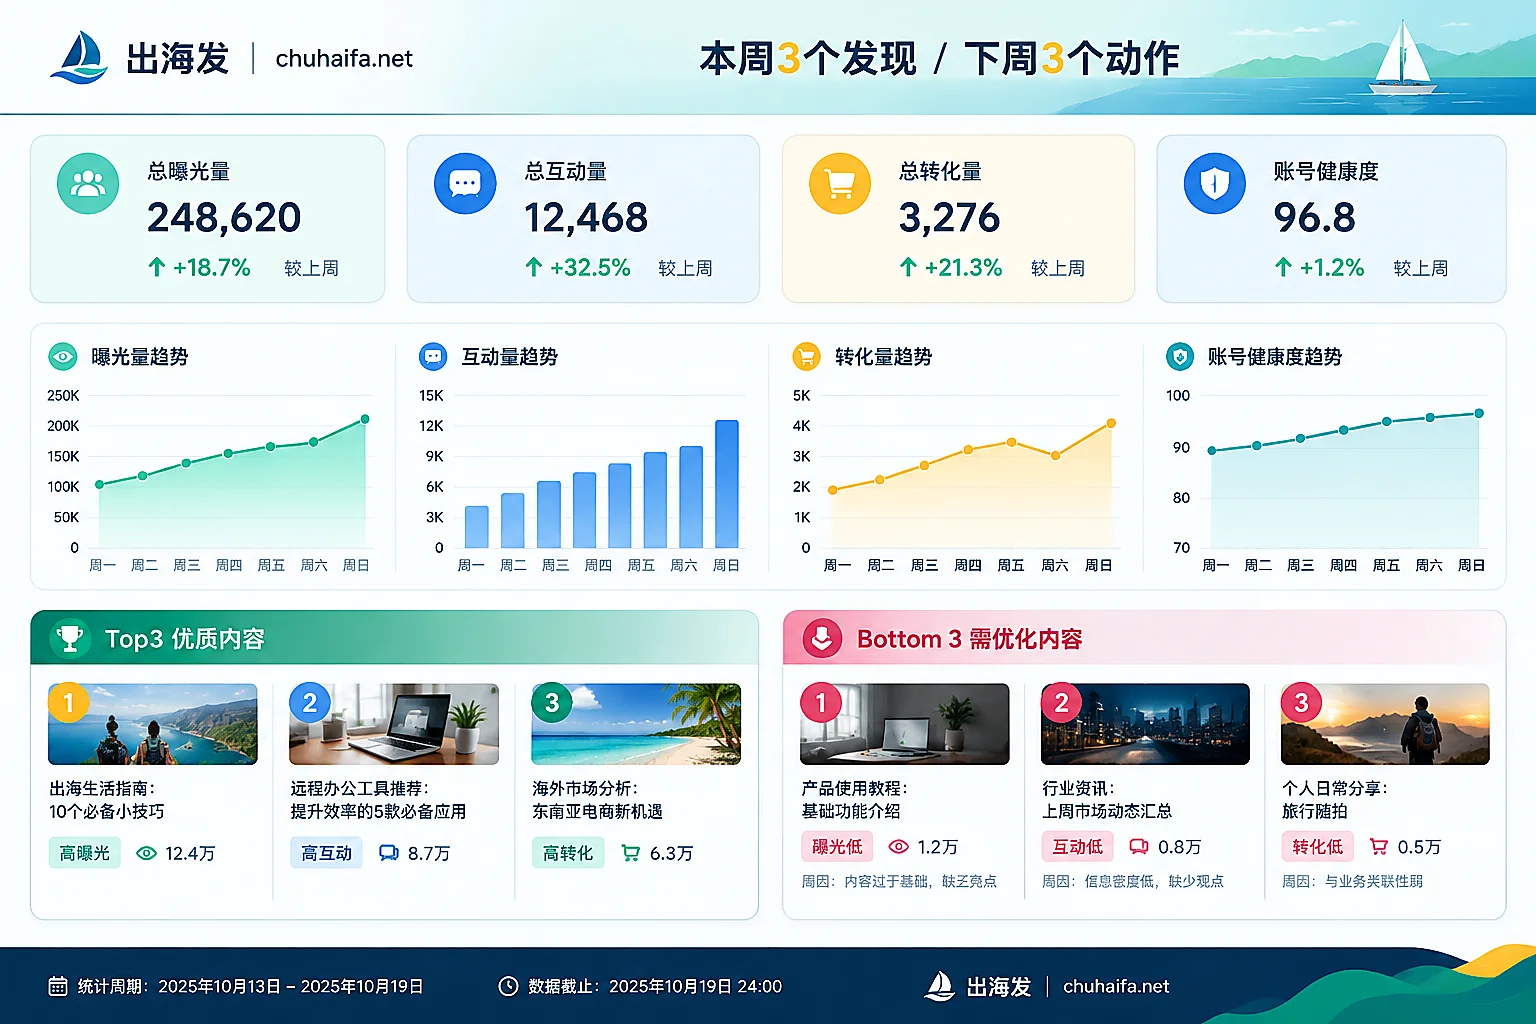
Aim for one page or less, in this order:
| Section | What to include | How to write it |
|---|---|---|
| Conclusions | 3 findings this week + 3 actions for next week | Put at the top so even those who only read this part get the key points |
| Core KPIs | 3–5 numbers tied to current goals | Mark week-over-week change and arrows for each |
| Layered data | Reach, engagement, conversion, account health | Only expand items with significant changes |
| Content review | Top 3 / Bottom with reasons | Attach screenshots or links |
| Notes | Measurement period, data cutoff, definition changes | So next week's comparison has a basis |
Where data comes from and what tools to use for aggregation
Most platforms' official backends provide most of the above metrics. If you operate a single platform, official backends are enough—see What Free Social Media Data Analysis Tools Are Available. When operating three or more platforms, manually copying numbers each week is error-prone. Unify fields first, then decide whether to merge manually or use automated connectors—see How to Aggregate Multi-Platform Social Media Data into One Table.
Once you've decided which metrics to track, if you need social media management, scheduling, and data aggregation tools, you can compare options in the Overseas Promotion category. If your weekly report also needs to merge ad campaign data to troubleshoot audience mismatches, check out the Ad Tools category. Tool features and prices are subject to their official websites.