

Let's get straight to the conclusion: no tool can see creatives from "all platforms." How much you can see is almost entirely determined by the type of tool you choose—official transparency libraries only show their own ecosystem, general Ad Spy tools cover mainstream social media, mobile vertical tools are the only ones with ad networks and playable ads, and Native-specific tools are the only ones with traffic sources like Taboola and Outbrain. Choose the wrong type, and it's not just that you get less data—the entire chunk of creatives you're looking for simply isn't in the library.
So the question shouldn't be "which tool has the widest coverage," but rather "which category of tool handles the lane I'm advertising in."
Four Tool Types, Four Coverage Boundaries
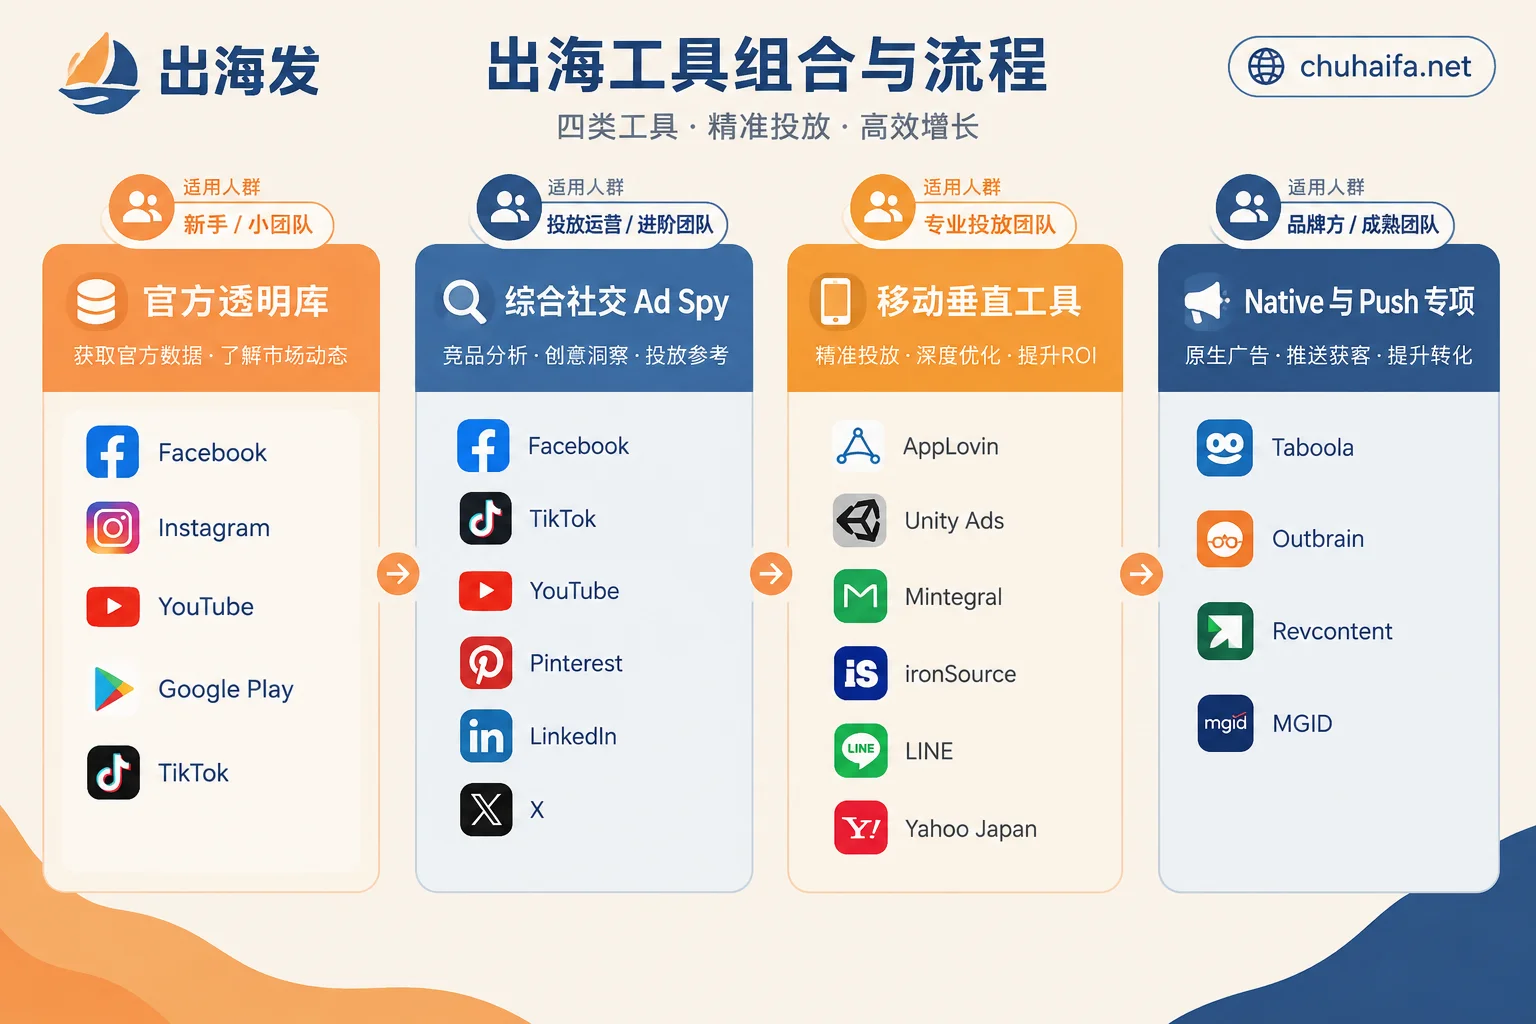
1. Official Platform Transparency Libraries: Only Their Own, But Closest to Full Volume
- Meta Ad Library: Covers Facebook, Instagram, Messenger, and Audience Network.
- Google Ads Transparency Center: Covers Google Search, YouTube, Display Network (GDN), and Google Play.
- TikTok: Has two separate entry points. Creative Center's Top Ads showcase high-performing ads globally, useful for creative inspiration; the Commercial Content Library mainly serves European compliance and regulatory review. Their purposes and data scopes are different—don't treat them as the same thing.
The advantage of official libraries is that they're free and fairly complete for advertisers within their own ecosystem. The limitations are also clear: you can't compare across platforms, you usually can't see historical lifecycle trends of creatives, and there are no industry heat metrics or estimated spend—common indicators for media buying analysis. For finding "what the original creative looks like," they're sufficient; for "who's ramping up in this category this month," they're not.
2. General Cross-Media Ad Spy: Horizontal Comparison of Mainstream Social
Tools like BigSpy, PowerAdSpy, and AdLibrary typically cover Facebook, Instagram, TikTok, YouTube, Twitter(X), Pinterest, LinkedIn, and some also include Yahoo. They solve what official libraries can't: putting creatives from the same category across multiple social channels side by side, to see ad duration and creative iteration.
For cross-border e-commerce, brand going global, and DTC standalone store product selection, the main tools basically fall in this layer.
3. Mobile App and Mobile Game Vertical: Ad Network Creatives Only Here
Platforms like SocialPeta and AppGrowing International, beyond top social media, focus on filling in two areas:
- Mobile ad networks and mediation monetization networks: AppLovin, Unity Ads, Mintegral, ironSource, AdMob, Chartboost, Vungle, etc.;
- Regional mainstream media: LINE, SmartNews, Yahoo! Japan in Japan and Korea, etc.
They also support monitoring playable ads, rewarded videos, and other creative formats unique to mobile.
The importance of this layer is often underestimated: a large amount of user acquisition creatives for mobile games and utility apps run on ad networks. If you only use general Ad Spy tools, you might see just a small slice of a competitor's ad spend—and mistakenly think they "haven't been advertising much lately."
4. Native and Push Specialized: The Dedicated Map for Arbitrage and Affiliates
Tools like AdPlexity and Anstrex specifically target native ad platforms like Taboola, Outbrain, Revcontent, MGID, as well as Push and Pop-under traffic networks. Their audience is concentrated: affiliate marketing, cross-border arbitrage, and standalone stores in specific verticals.
This traffic is basically invisible in the first three tool types. Conversely, using a Native-specific tool to check TikTok short video creatives is a mismatch.
Why There Are Always Parts You Can't See
Coverage gaps stem from different collection mechanisms:
- Official transparency libraries use platform-open compliance data APIs, with scope defined by the platform;
- Third-party commercial tools mainly rely on distributed crawlers, emulator automated rendering, or access to mobile SDKs and device data pools.
This determines that some types of traffic are hard to exhaustively cover: ads in closed private domains (e.g., in-community placements), and high anti-scraping feeds. From this, there are three practical takeaways worth remembering:
- What you see is a sample, not the full volume. If a creative doesn't appear in the library, you can't infer that "the competitor isn't advertising in that direction"—only that "this tool didn't capture it this time."
- Spend and impression numbers are mostly estimates, suitable for magnitude and trends, not for precise reporting or budget allocation.
- The list of niche regional platforms varies by vendor and changes over time. For channels like Middle Eastern local media or Latin American local ad networks, coverage depends on the vendor's latest update list—public pages often don't list them all. If you're targeting these markets, ask sales for the current channel support list directly; don't order based on last year's review articles.
Reverse-Engineer Tool Type from the Lane You're Advertising In
Flip the order: first determine the ad channels, then pick the monitoring tool—you basically won't buy wrong.
- Cross-border e-commerce / DTC standalone store product selection: Focus on the combination of TikTok + Meta + Pinterest. Official libraries (free, accurate original creatives) plus a general Ad Spy (horizontal comparison, ad duration) are enough for most teams.
- Mobile games / general entertainment app user acquisition: Must choose a vertical intelligence platform that includes AppLovin, Unity Ads, Mintegral, and other ad networks, and confirm it supports playable ad capture—otherwise most creatives are a blind spot.
- Search and affiliate promotion: Use Google Ads Transparency Center for search and YouTube, and Native-specific tools for Taboola and Outbrain—divide the work, don't expect one tool to cover everything.
- Focus on Japan and Korea: Separately confirm whether the tool covers LINE, Yahoo! Japan, and SmartNews. These channels are more commonly found only in mobile vertical tools.
If you're running both e-commerce and app lines simultaneously, a realistic approach is "one general + one vertical," rather than finding a tool that claims full coverage—the platform logo wall on the marketing page and the dimensions you can actually filter results by are often not the same thing.
Three Checks Before Paying
During the trial period, don't just browse the hot lists. These three things better judge whether the tool fits your needs:
- Search for creatives you're running yourself. Take ads you know are live and look them up in the library—see if they're found and if the data matches. This is the only way to verify capture depth.
- Confirm whether the filtering dimensions are fine enough. Can you filter by target country, language, ad duration range, landing page type? Tools that only allow coarse filtering by platform and category will quickly become insufficient during product selection.
- Confirm whether creative formats are supported. Playable ads, rewarded videos, carousel ads, dynamic product ads—support varies greatly by vendor. If the official site doesn't state it clearly, ask directly.
Also a reminder: some monitoring tools and official transparency libraries have access restrictions by region, and multiple team members querying in parallel may trigger risk controls. Checking creatives itself requires a stable overseas network environment as a prerequisite—factor this cost in advance.
Where to Go Next to Choose
Once you've determined which type of monitoring tool to use, you can go to Ad Tools Category to filter specific product entries by type; if your access environment isn't set up yet, Overseas Network Category has proxy and node tools to solve the prerequisite first.
Creative monitoring is just one link in the advertising chain. To think through channel combinations before deciding which platforms' creatives to view, you can first read How to Arrange Channel Combinations for Overseas Traffic Acquisition; for attribution of performance drops after creatives go live, another article Guide to Using Social Media Data Analysis Tools to Locate Performance Drops During Peak Season Buildup goes into more detail.