

What counts as a low engagement rate for product videos has no universal passing line across different denominators. By views, below 2% is a low zone needing review (2026 industry median 3.30%–3.85%); by followers, the median is only 1.70%–2.01%. To judge your own data, look at three conditions: denominator, sample size, and funnel position. Wrong denominator means everything after is invalid; insufficient samples make conclusions unreliable; if you're not in the funnel, even high numbers don't help. Let's break it down in that order.
First, Align the Formula: Two Denominators for Engagement Rate, Why the Same Video Can Yield Two Numbers
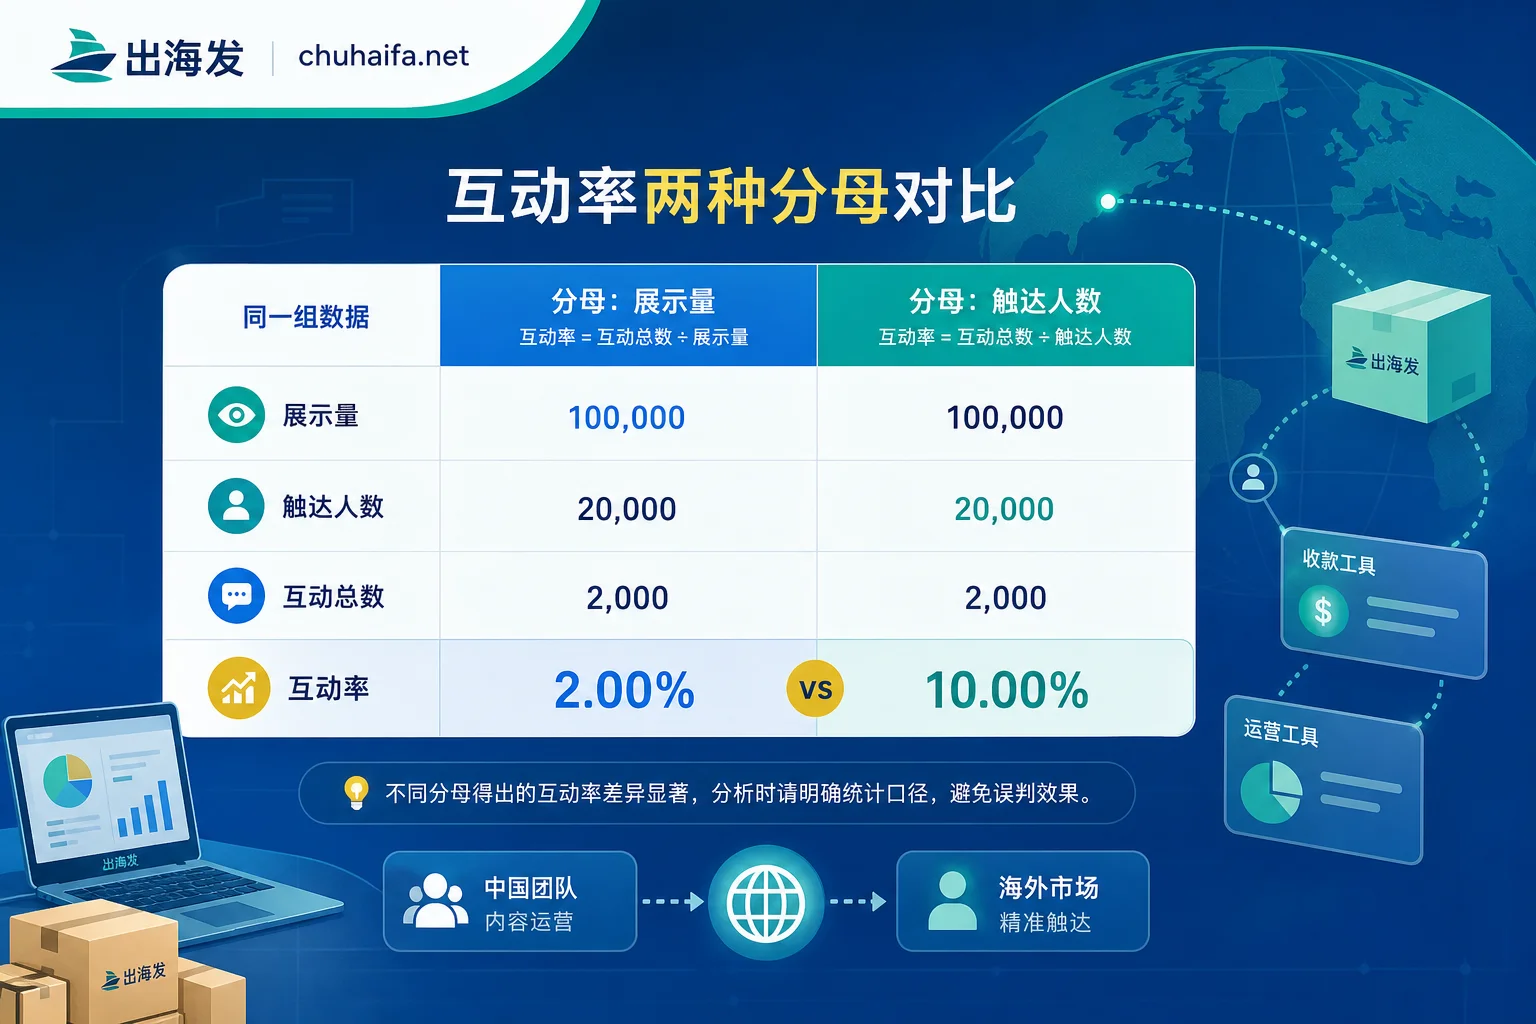
Many operators directly compare backend numbers to online tutorials and panic. The issue often lies in the formula. There are two mainstream algorithms: by views, the formula is 总互动数 ÷ 播放量 × 100; by followers, it's 总互动数 ÷ 粉丝量 × 100. With the same data, different denominators can double the result.
In a strong recommendation-based distribution system, most of a video's exposure comes from the recommendation feed, not your followers. Socialinsider's April 2026 industry benchmark report points out that calculating by views better reflects audience involvement in a single product video. So before comparing to any benchmark, check which denominator your backend uses. Don't match follower-based numbers against views-based benchmarks, or you'll misjudge your actual level.
If you operate on multiple platforms like TikTok and Reels simultaneously, the engagement rate metrics in each backend may differ. To align the formulas, your team needs a fixed data-checking tool. You can pick one from the social media data analysis and short-video marketing tools category on Chuhai Fa Navigation, unify the denominator first, then compare.
Three Benchmark Tiers: What's Low, Normal, and High
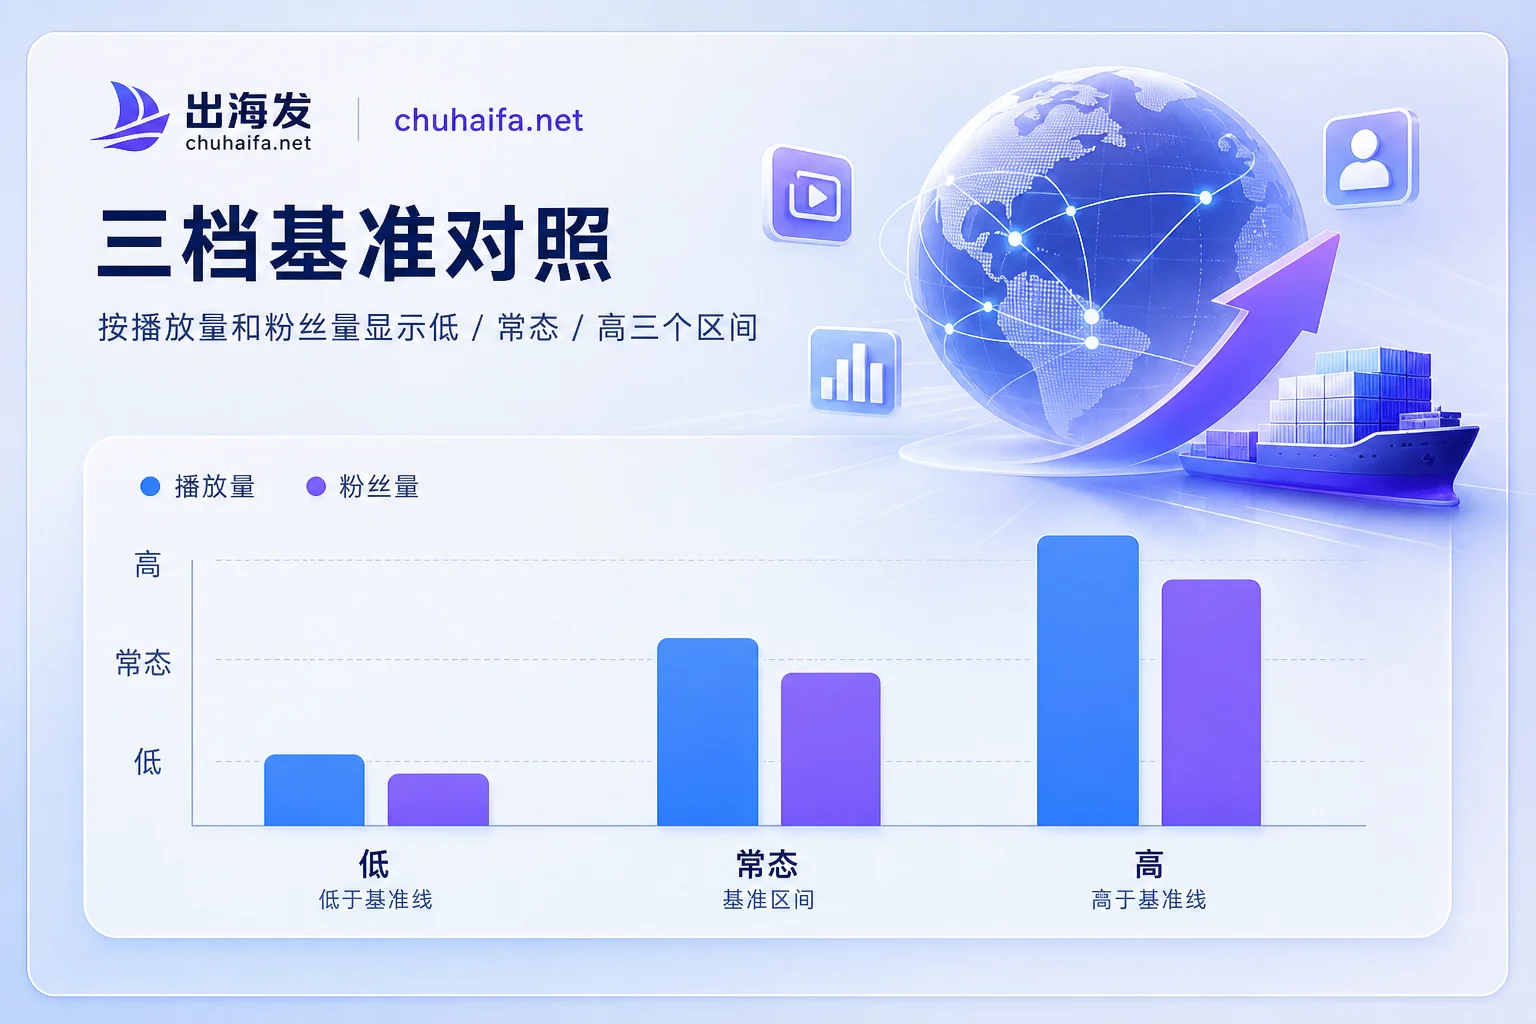
To answer what's a low engagement rate for product videos, 2026 industry data provides relatively reliable references—but there's no cross-denominator universal passing line. By views, the normal median for brand accounts is about 3.30%–3.85%, with some broad calculations extending to 3.30%–4.15%; by followers, the median is only 1.70%–2.01%.
| Denominator | Low Zone | Normal Median | High Zone |
|---|---|---|---|
| By Views | Below 2% | 3.30%–3.85% (up to 4.15% with broad definitions) | Above 4.15% |
| By Followers | Below 1.2% | 1.70%–2.01% | Above 2.5% |
In the table, only the "views-based below 2% is low" and the two median ranges come from public benchmarks by Hootsuite (June 2026) and Socialinsider (April 2026); the low/high boundaries for follower-based and the high line for views-based are operational experience values extrapolated from medians, not official published data. The above benchmarks are all-industry averages; differences across categories are huge. Product videos have clear shopping intent, and general entertainment likes tend to be fewer, so they may be below entertainment averages, but conversions may not be worse.
When judging, always use the median of your recent 30 videos, not a single viral hit or a single flop. If the sample size is insufficient, the conclusion doesn't hold.
Engagement Rate Is No Longer the Only Metric: Weight Shifts for Completion, Shares, and Add-to-Cart Signals
Many operators agonize over "which is more important for product videos: completion rate or engagement rate?" From 2026 algorithm trends, the answer is clear: completion rate has become more important than shallow engagement. Sprout Social's February 2026 guide and Metricool's May 2026 research both note that platform recommendation algorithms have structurally reduced the weight of light likes, prioritizing completion rate, average watch time, proactive DMs, off-platform shares, comment depth, and for e-commerce scenarios, product card clicks and add-to-cart actions.
That means if your views-based engagement is below 2%, don't immediately write it off. First check whether the same batch's completion rate and product card click-through rate are at normal levels. Low engagement with both those strong is a lower priority issue than low engagement with both weak. This is good news for product videos: even if engagement is low, as long as completion and product clicks/add-to-cart perform well, there's still a strong chance of entering a larger recommendation pool. So, low engagement isn't necessarily bad—you need to see where it's low.
Three Causes of Low Engagement: Didn't Finish Watching, Finished but Unwilling to Share, Willing to Share but Not Buying
Even with engagement below 2%, the underlying reasons can be completely different. Based on 2026 industry analyses from Hootsuite, Sprout Social, and Metricool, problems can be split into three categories, each with accompanying metrics:
| Cause | Symptoms | Accompanying Metrics | Direction |
|---|---|---|---|
| Didn't finish (Hook failure) | High early drop-off in first 3 seconds, low engagement | 3-second retention, completion rate | Rework opening hook, cut fluff |
| Finished but won't share (Missing trigger) | Completion rate OK, but zero interaction | Comments, shares, DMs | Add comment prompts, share reasons |
| Willing to share but not buying (Traffic mismatch) | High engagement, zero add-to-cart | Product card CTR, add-to-cart rate | Adjust traffic audience, strengthen CTA |
High views with low engagement is most likely the first type: heavy traffic but content fails to capture. High engagement but no conversion is usually the third: broad traffic with weak purchase intent. First determine which type you fall into, then make changes.
Handling Order: Fix the First 3 Seconds First, or Hooks and Comment Prompts?
Recommend fixing from front to back along the funnel. If 3-second retention is subpar, tweaking comment prompts is wasted effort because users aren't even watching. Similarly, if completion is already good but no one comments, then add comment hooks.
In practice, change one variable at a time, then compare the median of the last 30 videos in batches. For example, optimize the first 3 seconds first, post 10 new videos, see if the median moves from 2% to above 3%, then decide next steps. Don't change multiple factors at once, or you'll never know which change worked.
If you suspect your TikTok account is shadowbanned, refer to this post on how to recover from TikTok shadowban, check account health first, then talk about metric optimization.
Weekly Data Check Routine: What Numbers to Look At and How Much Sample Is Meaningful
Set a fixed time each week for a data check, following this checklist:
- Confirm denominator: whether the backend uses views or followers, and record it.
- Take the median engagement rate of the last 30 videos, not the average (to avoid being skewed by a viral hit).
- Record 3-second retention and completion rate to judge Hook effectiveness.
- Count shares and DMs to measure proactive sharing intent.
- Check product card CTR and add-to-cart rate to confirm the conversion path.
- If operating on multiple platforms, use a unified tool to align formulas and avoid misjudgment due to inconsistent denominators.
When denominators differ across platforms, you can pick a fixed tool from the social media data analysis and short-video marketing tools category on Chuhai Fa to standardize the process of pulling the 30-video median.
Sample size isn't about being as large as possible; at least 30 recent videos are needed for statistical significance. Below that, you can observe but shouldn't conclude. If the sample size is chronically insufficient, it often means content production or influencer collaboration pace is limited. For that, see what to do when influencer messaging quota runs out.
If you frequently post videos across platforms, managing volume is also key—like how many product videos can you post per day on TikTok Shop—as it affects your data sample structure and review frequency.
FAQ
Is a 2% engagement rate high or low?
What counts as low for product videos depends on the denominator: by views, 2% is in the low zone and needs review; by followers, 2% is near the upper median, so it's normal to above-average. So first check the denominator, then compare to the table above. The median of the last 30 videos is more accurate; a single 2% doesn't mean much.
Why high views but low engagement?
Usually it's "didn't finish watching" or "finished but didn't share." High views means recommendation distribution is normal, but the first 3 seconds may not be compelling enough, leading to low completion; or completion is okay, but lacking comment and share prompts. Use 3-second retention and completion rate to pinpoint further.
What if engagement is high but no conversions?
That's typically traffic mismatch: attracting broad entertainment audiences with weak purchase intent. Check whether comments are irrelevant to the product, then look at product card CTR and add-to-cart rate. If product card CTR is low, your CTA guidance is lacking; if clicks are high but add-to-cart is low, review the product detail page and price.
Which is more important for product videos: completion rate or engagement rate?
In 2026, platform algorithms clearly weight completion rate more heavily, and the importance of shallow likes in engagement has declined. For product videos, completion rate is more critical because it directly affects promotion in the recommendation pool. But they don't conflict: completion is the entry ticket, engagement is the amplifier, and conversion is the endgame.
Is there an official platform restriction threshold?
Short-video platforms have never publicly set any hard rule like "below X engagement rate means shadowban or ban," so absolute elimination lines circulating online have no official basis. What's called shadowbanning is more often due to content quality, violations, or account weight. Low engagement only affects how much natural traffic the algorithm gives; there's no fixed penalty line.